Tunisia Key Figures
- Population:
- 12.4 million
- GDP growth rate:
- 2.52 %/year
- Energy independence:
- 45.0%
Data of the last year available: 2022
- Total consumption/GDP:*
- 97.9 (2005=100)
- CO2 Emissions:
- 2.16 tCO2/capita
- Rate of T&D power losses:
- 19.9%
* at purchasing power parity
View all macro and energy indicators in the Tunisia energy report
Tunisia Related News
View all news, archive your new and create your own daily newsletters only on your topics/countries of interest with Key Energy Intelligence
Tunisia Related Research
Benefit from up to 2 000 up-to-date data series for 186 countries in Global Energy & CO2 data
A data overview is available in the global energy statistics app
Total Energy Consumption
The country's per capita consumption is 0.9 toe in 2022, which is 3 times lower than the EU average but average for the region. Its per capita electricity consumption is around 1 550 kWh (2022), also close to the average for North African countries (1 460 kWh).
Total energy consumption stayed stable in 2022 at 11.6 Mtoe (close to its 2017-2019 average), after a 5% drop in 2020 (consequence of the Covid pandemic) and an 8% rebound in 2021. Growth in total consumption has slowed down since 2010, to 1.1%/year over 2010-2019 compared to 3.5%/year between 2000 and 2010.
Interactive Chart Tunisia Total Energy Consumption
Benefit from up to 2 000 up-to-date data series for 186 countries in Global Energy & CO2 data
View the detailed fondamentals of the market at country level (graphs, tables, analysis) in the Tunisia energy report
Crude Oil Production
After a rapid increase in 2021 (+23%) due to the commissioning of the Halk el Manzel field, oil production decreased by 14% in 2022 to 1.8 Mt and by 5% in 2023 (preliminary estimates). Since 2007, production has decreased by 6%/year on average. Exceptionally, it increased significantly in 2007 (+39%) through the exploitation of several small wells in southern Tunisia, mainly the offshore field of Oudna (80 km from the coastline in the Gulf of Hammamet, with a production of around 15 kb/d).
Interactive Chart Tunisia Crude Oil Production
Benefit from up to 2 000 up-to-date data series for 186 countries in Global Energy & CO2 data
Additionally, for more detailed information on refineries, you can request a sample of our EMEA Refineries Dataset
Oil Products Consumption
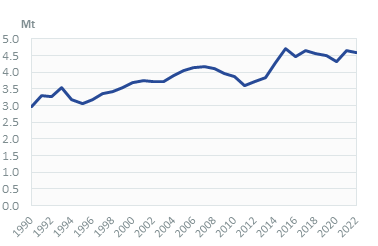
Oil product consumption has been slightly declining since 2015 (by 0.5%/year), with a 1.7% drop in 2022 to 4.5 Mt. According to preliminary estimates, it dipped again by 3% in 2023. Previously, it had decreased by 3.6%/year between 2007 and 2011 before rising by 7%/year until 2015.
Transport accounts for 52% of this consumption, followed by residential and services sector (22%) and industry (20%) (2022).
Graph: OIL CONSUMPTION (Mt)
Interactive Chart Tunisia Refined Oil Products Production
Benefit from up to 2 000 up-to-date data series for 186 countries in Global Energy & CO2 data
Additionally, for more detailed information on refineries, you can request a sample of our EMEA Refineries Dataset
Natural Gas Consumption
Gas consumption decreased by 2% in 2022 to 6.5 bcm, as reduced gas supplies from Algeria limited the demand from the power sector (-8%). According to preliminary estimates, supply limitations contributed to reduce gas consumption again in 2023 (-3%, including -2% for power generation and -6% for final consumption).
Previously, gas consumption doubled between 2000 and 2010 and slowed down between 2010 and 2021 (+0.9%/year) to 6.6 bcm.
Interactive Chart Tunisia Natural Gas Domestic Consumption
Benefit from up to 2 000 up-to-date data series for 186 countries in Global Energy & CO2 data
Additionally, for more detailed information on the LNG trade, you can request a sample of our EMEA LNG Trade Dataset
Coal Consumption
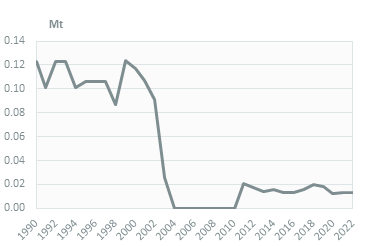
Coal consumption has almost completely disappeared. Coal was mainly used in the cement industry, where it was replaced by petroleum coke.
Graph: COAL CONSUMPTION (Mt)
Graph: COAL CONSUMPTION BREAKDOWN BY SECTOR (2022, %)
Interactive Chart Tunisia Coal and Lignite Domestic Consumption
Benefit from up to 2 000 up-to-date data series for 186 countries in Global Energy & CO2 data
View the detailed consumption trends at country level (graphs, tables, analysis) in the Tunisia energy report
Power Consumption
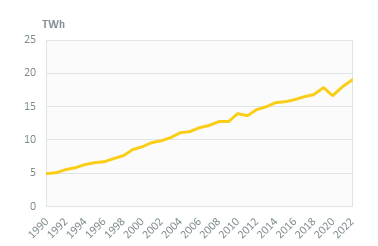
Electricity consumption is rising rapidly since 2020: by 7.8% in 2021 and 6% in 2022 to reach 19 TWh, after a 6% drop in 2020. It has increased nearly fourfold since 1990.
The residential sector accounts for 33% of consumption, followed by industry (31%) and services (26%) (2022).
Graph: ELECTRICITY CONSUMPTION (TWh)
Graph: ELECTRICITY CONSUMPTION BREAKDOWN BY SECTOR (2022,%)
Renewable in % Electricity Production
In the framework of the Solar Plan, the Parliament adopted a law on renewables in 2015 aimed at covering 12% of its power mix with renewables by 2020 and 35% by 2030 (corresponding to a capacity of 3.8 GW, around 500 MW/year over a period of 8 years and an investment of US$7.1bn between 2016 and 2030, equal to US$294m/year). However, the development of the programme is far behind the initial schedule; with less than 4% of renewables in the power mix in 2020, the 2020 target has not been reached.
Interactive Chart Tunisia Share of Renewables in Electricity Production (incl hydro)
Benefit from up to 2 000 up-to-date data series for 186 countries in Global Energy & CO2 data
CO2 Fuel Combustion/CO2 Emissions
In its updated NDC (2021), Tunisia set an unconditional carbon intensity reduction target of 27% in 2030 compared to 2010 levels and a conditional reduction target up to 45% with international support (from 23.4 MtCO2 to 12.9 MtCO2). The total budget for reaching the mitigation targets is estimated at around US$14.4bn.