South Korea Key Figures
- Population:
- 51.6 million
- GDP growth rate:
- 1.45 %/year
- Energy independence:
- 20.6%
Data of the last year available: 2023
- Total consumption/GDP:*
- 79.7 (2005=100)
- CO2 Emissions:
- 11.0 tCO2/capita
- Rate of T&D power losses:
- 3.37%
* at purchasing power parity
View all macro and energy indicators in the South Korea energy report
South Korea Related News
View all news, archive your new and create your own daily newsletters only on your topics/countries of interest with Key Energy Intelligence
South Korea Related Research
Benefit from up to 2 000 up-to-date data series for 186 countries in Global Energy & CO2 data
A data overview is available in the global energy statistics app
Total Energy Consumption
Per capita consumption was around 5.6 toe/cap in 2023 (including 11 MWh/cap of electricity), which is 50% higher than the OECD average.
Total energy consumption decreased by almost 3% in 2023 to 291 Mtoe. Previously, it progressed by 1.5%/year over 2010-2022.
Interactive Chart South Korea Total Energy Consumption
Benefit from up to 2 000 up-to-date data series for 186 countries in Global Energy & CO2 data
View the detailed fondamentals of the market at country level (graphs, tables, analysis) in the South Korea energy report
Crude Oil Production
Korea depends on imports to meet its crude oil demand, mostly from the Middle East. Net crude oil imports decreased by 2.8% in 2023 to 137 Mt, following a sharp rise in 2022 (+7.6%).
Interactive Chart South Korea Crude Oil Production
Benefit from up to 2 000 up-to-date data series for 186 countries in Global Energy & CO2 data
Additionally, for more detailed information on refineries, you can request a sample of our Asia Refineries Dataset
Oil Products Consumption
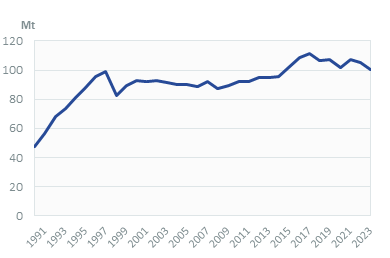
Oil consumption decreased by 4.3% in 2023 to 101 Mt, slightly above with the trend observed over 2017-2022 (-2.6%/year).
Non-energy uses represent almost half of the oil demand (47% in 2023) and are followed by transport, which accounts for 31% of this consumption.
Graph: OIL CONSUMPTION (Mt)
Graph: OIL CONSUMPTION BREAKDOWN BY SECTOR (2023, %)
Interactive Chart South Korea Refined Oil Products Production
Benefit from up to 2 000 up-to-date data series for 186 countries in Global Energy & CO2 data
Additionally, for more detailed information on refineries, you can request a sample of our Asia Refineries Dataset
Natural Gas Consumption
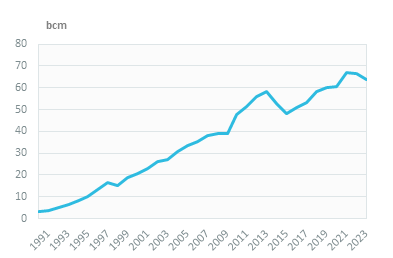
Gas demand decreased by 4% in 2023 to 64 bcm. It increased rapidly over 2015-2021 (5.6%/year) and remained stable in 2022. It contracted in 2014 and 2015 due to some nuclear restarts.
In 2023, 55% of the natural gas was used in power plants, 25% in buildings, and 14% in the industrial sector. Since 2015, buildings and industry have lost 5% each, respectively, mainly in favour of power plants (+6% points).
Graph: NATURAL GAS CONSUMPTION (bcm)
Interactive Chart South Korea Natural Gas Domestic Consumption
Benefit from up to 2 000 up-to-date data series for 186 countries in Global Energy & CO2 data
Additionally, for more detailed information on the LNG trade, you can request a sample of our Asia LNG Trade Dataset
Coal Consumption
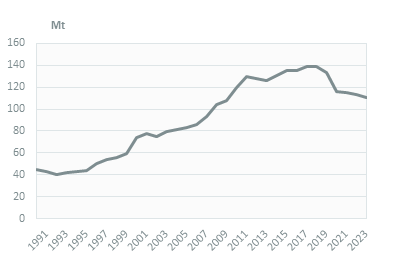
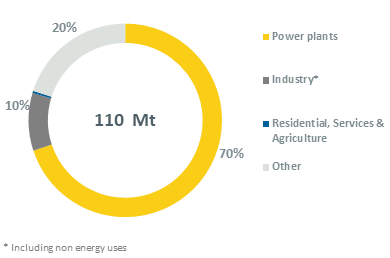
Coal consumption fell by almost 3% in 2023 to 110 Mt, after a sharp decrease between 2018 and 2022 (-5%/year). It increased by around 2%/year over 2010-2018.
Power plants accounted for 70% of coal consumption in 2023 and industry for 20%.
Graph: COAL CONSUMPTION (Mt)
Graph: COAL CONSUMPTION BREAKDOWN BY SECTOR (2023, %)
Interactive Chart South Korea Coal and Lignite Domestic Consumption
Benefit from up to 2 000 up-to-date data series for 186 countries in Global Energy & CO2 data
View the detailed consumption trends at country level (graphs, tables, analysis) in the South Korea energy report
Power Consumption
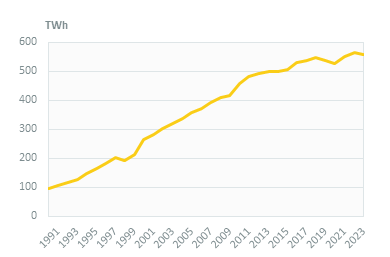
Electricity consumption decreased by 1.3% in 2023 to 557 TWh. It had rebounded between 2020 and 2022 by 3.5%/year after a decrease in 2019 and 2020 (-1.6%/year) and steady growth between 2010 and 2018 (2.2%/year).
Industry absorbs half of the electricity consumption (49%), services 32%, and households 13%. The distribution has been similar since 2010.
Graph: ELECTRICITY CONSUMPTION (TWh)
Graph: ELECTRICITY CONSUMPTION BREAKDOWN BY SECTOR (2023, %)
Renewable in % Electricity Production
KEA supports and promotes renewable energies.
The 10th Basic Plan for Long-Term Electricity Demand and Supply 2023-2036 of MOTIE (2023) revised downwards its renewables target to 22% and 31% of the power mix in 2030 and 2036, respectively (against 40% in 2034 in the previous Basic Plan). MOTIE plans to add 40 GW of renewables by 2030, generating 134 TWh in 2030 (204 TWh in 2036).
Interactive Chart South Korea Share of Renewables in Electricity Production (incl hydro)
Benefit from up to 2 000 up-to-date data series for 186 countries in Global Energy & CO2 data
Learn more about renewables in the Mini grid Africa & Asia markets for village electrification
CO2 Fuel Combustion/CO2 Emissions
In its updated NDC (2021), the country almost doubled its reduction target for total GHG emissions in 2030 to 40% (excl. LULUCF), compared to 2018 level, from 24.4% previously. In 2020, the country also committed to achieving carbon neutrality by 2050. GHG emissions decreased by around 7% between 2018 and 2021, i.e. less than a fifth of the 2030 target.
CO2 emissions from fuel combustion decreased by 4.1% in 2023 to 569 MtCO2. Since a peak in 2018, they have decreased by 15%.
Graph: CO2-ENERGY EMISSIONS (MtCO2)